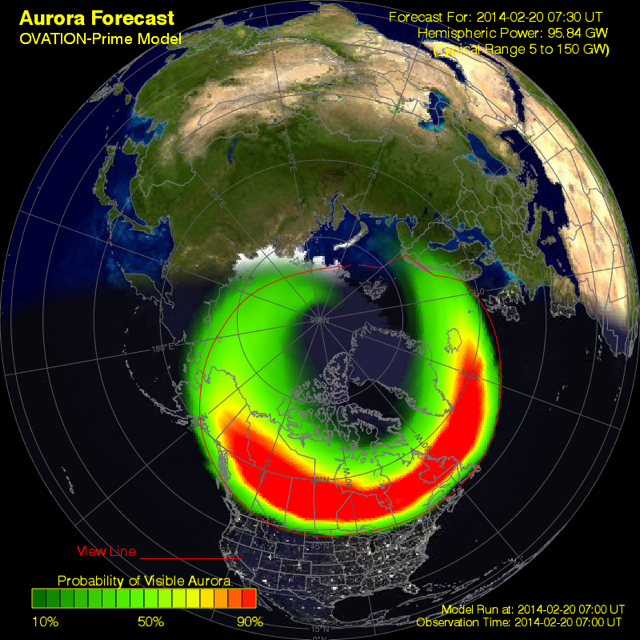
Aurora Forecasting
Some of the best aurora forecasting data comes from satellites orbiting Earth and the Sun that give advance notice about solar events. Other good primary data comes from magnetometers, all-sky cameras, and solar imaging cameras at institutions and observatories around the world. Aurora photographers who learn how to access and interpret primary data from original sources will have the best understanding of aurora probabilities. Some institutions do an excellent job of organizing the data which means we can spend more time thinking about photography and less about auroral science and space weather.
There are thousands of aurora forecasts out there and they almost all derive their data from NOAA. Usually they are governments, municipalities, businesses or guides trying to look authoritative about the aurora and attract web traffic or clients. But these secondary resources are just repackaging NOAA’s data and sometimes even charging for it. A few websites add value, for example, by embedding tools like a local magnetometer or integrating regional weather and cloud cover. You can get the best information for free directly from NOAA and other primary sources.
Alerts and forecasts often use different scales, so you need to pay attention to the unit of measurement. For example, the Ovation model, POES doughnut and Kp all use different scales. UTC (Coordinated Universal Time) is the standard used by most globally-relevant forecasts. Metric prevails everywhere except Alaska, where distances are shown in miles and temperatures are given in Fahrenheit. When you arrive in a new time zone, calculate your time off UTC and doublecheck the units of measure used by regional alerts and forecasters. When it’s dark and you’re short on sleep, even the easiest calculations can seem confusing.
Some aurora experts sell text alerts and offer subscription-based programs. Some resources are good value and some are not. Some apps are worth every penny, some not so much. But you don’t need to spend anything to access the best space weather data.
Primary data sources
Images of the sun
Astronomers watch the sun for sunspots and flares and make predictions based on current and historical observations. Because the sun rotates every 27 days, features come around again and again so there’s some predictability – this model is called the Carrington rotation – particularly near the peak of the 11-year solar maximum. When they see something large lobbed off the sun they forecast when they think it’s going to arrive to Earth, maybe 1 or 2 days out. Detailed images of the sun’s surface are captured from Earth and also from spacecraft that orbit the sun. By compiling images from multiple locations, researchers can build a 360-degree picture of the sun.
Satellites
Spacecraft in orbit around the Sun can provide critical information about solar activity that contribute to both space weather and Earth weather forecasts. They monitor the stream of particles coming off the sun and provide valuable advance alerts about major geomagnetic events. In particular, satellite operators depend on this data to protect their spacecraft from the hazards of space weather.
Satellites orbiting around Earth NOAA’s POES (Polar Operational Environmental Satellites) program operates a constellation of polar-orbiting weather satellites that record global climate data and track energy-charged particles. NOAA uses this data to estimate the power deposited in a polar region by these particles and convert it to an auroral activity index.
The Space Weather Prediction Center pulls together all the information you need onto their website. Sign up for the SWPC Product Subscription service so you’ll receive their alerts, warnings, watches, forecasts and summaries via email.
Kp is a common index used to describe the severity of global geomagnetic disturbances near Earth. The index is on a scale of 0 to 9 – the higher the number, the greater the storm. The name Kp originates from the German planetarische Kennziffer, which means planetary index. Kp data has been collected for decades and uses available solar wind measurements to calculate the latest predicted geomagnetic activity. Kp-index is calculated as a weighted mean of data collected from magnetic observatories around the world. The most powerful Kp forecast is the Wing Kp Predicted Geomagnetic Activity Index. This index is produced by the U.S. Air Force and is made available through NOAA.
Magnetometers
Magnetometers measure electric currents in the ground and generate magnetograms that can be very powerful indicators of aurora. Magnetic observatories are permanent measuring stations that use ground-based instruments to measure fluctuations in the magnetic field of the Earth.
- Tromsø, Norway (Tromsø Geophysical Observatory) http://flux.phys.uit.no/cgi-bin/plotgeodata.cgi?Last24&site=tro2a&
- Kiruna, Sweden (Swedish Institute of Space Physics) http://www.irf.se/Observatory/?link[Magnetometers]=Data/
- Finnish Meteorological Institute map of real-time magnetometer station data: http://www.ava.fmi.fi/image/realtime/UT/
- Alaska Satellite Facility magnetometer network (University of Alaska Fairbanks) https://www.asf.alaska.edu/magnetometer/liveplot/
All-sky cameras
There’s nothing more motivating than seeing real-time broadcasts of the northern lights. Though they may not be in your area, you can learn a lot from watching the live views as well as the archives. If I’m not already out there, when there’s visible aurora a couple of time zones east of my location, it’s time to hustle. But all-sky cameras are also problematic; they’re weather-dependent, affected by daylight and light pollution, and seem to have frequent operational issues.
- Poker Flat, Fairbanks, Alaska (UAF Geophysical Institute) http://allsky.gi.alaska.edu/
- Yellowknife, NWT, Canada (Canadian Space Agency/AuroraMax) http://www.asc-csa.gc.ca/eng/astronomy/auroramax/hd-480.asp
- Tromsø, Norway (National Institute of Polar Research) http://polaris.nipr.ac.jp/~acaurora/aurora/Tromsø/latest.jpg
- Longyearben, Svalbard, Norway (National Institute of Polar Research) http://polaris.nipr.ac.jp/~acaurora/aurora/Longyearbyen/latest.jpg
- Sodankylä, Finland (courtesy University College London) http://www.sgo.fi/Data/RealTime/Kuvat/UCL.jpg
- Kiruna, Sweden (Swedish Institute of Space Physics) http://www.irf.se/allsky/rtasc.php